اطلاعیه

بستن

راهنمای فروم - حتما بخوانید

با سلام

قابل توجه کاربران محترم تالار گفتگو

قبل از ارسال پست یا ایجاد موضوع جدید، تاپیک قوانین و راهنمای فروم را مطالعه نمائید.

کاربران و مخصوصا تازه واردین لطفا دقت باشید که هرگونه پیشنهاد مدیریت سرمایه یا فروش تحلیل و یا برگزاری کلاس و ... که خارج از محیط عمومی فروم باشد را به هیچ عنوان بدون تحقیق و کسب اطلاعات کامل و کافی دنبال نکنید در غیر این صورت مسئولیت و عواقب آن بر عهده خود شخص می باشد.

همچنین لازم به ذکر است مسئولیت ارتباطات خارج از پست های عمومی فروم اعم از پیام خصوصی یا چت یا دیداری یا شنیداری با سایر اعضای فروم کاملا با خود اعضا هست و وارد کردن آن به صورت عمومی در فروم ممنوع است. برای امنیت بیشتر جهت گرفتن پاسخ سوالات خود از انجمنها استفاده نمایید.

دوستان توجه داشته باشند که تمامی بخش های اختصاصی و عمومی فروم کاملا رایگان بوده و به هیچ عنوان نیاز به پرداخت وجه به هیچ کس برای باز شدن دسترسی نیست.

منتها به این دلیل که در این بخش ها معمولا کار تیم ورک و گروهی انجام میشود، مناسب ورود افراد با شرایط خاصی است که مدیر آن بخش تعیین میکند و برای همه افراد کارایی ندارد چون مستلزم بر عهده گرفتن مسئولیت یا دانش کافی در آن حوزه می باشد.

لذا ضمن پوزش از کاربرانی که تقاضای دسترسی آن ها به بخش های اختصاصی توسط مدیران بخش رد میشود، توصیه میکنیم که پس از فراگیری موضوعات عمومی و تخصصی فراوانی که در روی فروم قرار دارد چنانچه برنامه ویژه ای برای کار در بخش های اختصاصی و کار گروهی دارند آن را مکتوب برای مدیران هر بخش بنویسند و سپس اقدام به درخواست دسترسی بکنند.


با احترام
مشاهده بیشتر
مشاهده کمتر

اندیکاتورهای زیبا

بستن
X
 
  • فیلتر کردن
  • زمان
  • نمایش
پاک کردن همه
پست های جدید

  • #91
    نوشته اصلی توسط mojtabaei نمایش پست ها
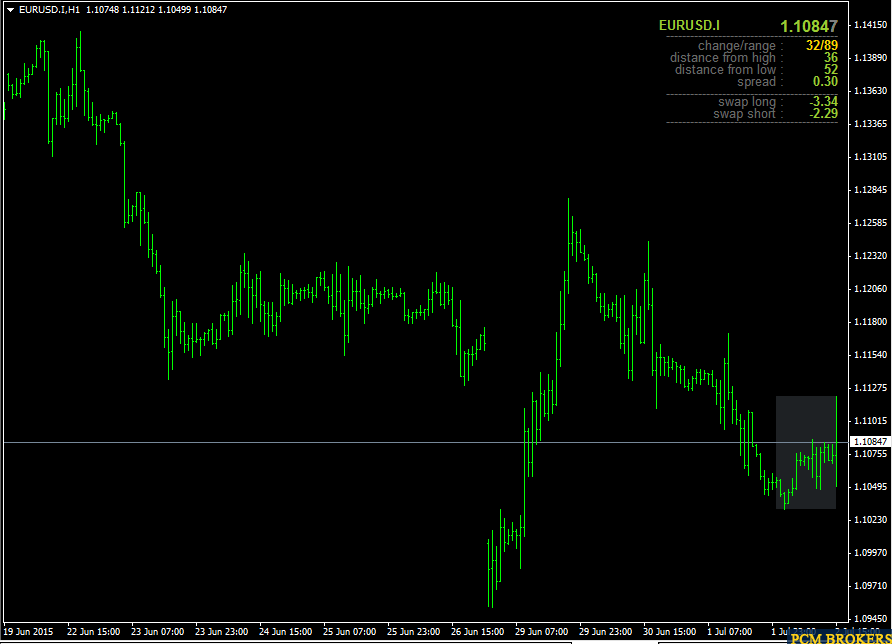
    سلام. یه اندیکاتور هست که اطلاعات روز جاری را میده مثل
    pips to open
    hi to low
    distance from hi
    distance from low
    spread
    فکر کنم اسمش daily data بود دوستان اگر دارن لطفا آپلود کنن.
    ممنون
    DailyData


    پ ن: دوستان درخواست اندیکاتور خود را در این تاپیک مطرح کنید. تشکر
    ویرایش توسط Seyedi : https://www.traderha.com/member/14738-seyedi در ساعت 07-02-2015, 05:35 PM

    نظر


    • #92
      نوشته اصلی توسط cold_fear نمایش پست ها
      معلومه که اصلاحیه دوست عزیز
      علم غیب که ندارن اندیکاتورا اینجوری سیگنال بدن
      اگه اصلاحی نبود با همین یه دونه اندیکاتور یه هفته ای میشد میلیاردر بشه آدم
      با اندیکاتورها باید سیستم طراحی کرد،باید ازشون راهنمایی خواست برای تحلیل بهتر
      یه زمانی خودم فکر میکردم که اندیکاتور خوب هست و کلی وقت و انرژیمو تلف کردم
      خیلی از تریدرای بزرگ هم میبینی یه RSI یا یه Stochastic انداختن گوشه چارت و از اندیکاتورهای جذابی که هیچی هم نیستن استفاده نمیکنن
      صرفا نظرات خودمو گفتم تا وقتتونو تلف نکنید با این چیزا،همه چی تو خود چارته
      با اندیکاتورها باید سیستم طراحی کرد،باید ازشون راهنمایی خواست برای تحلیل بهتر =!
      یه زمانی خودم فکر میکردم که اندیکاتور خوب هست و کلی وقت و انرژیمو تلف کردم


      ....... کد نویس .......

      نظر


      • #93
        نوشته اصلی توسط afshin1024 نمایش پست ها
        با اندیکاتورها باید سیستم طراحی کرد،باید ازشون راهنمایی خواست برای تحلیل بهتر =!
        یه زمانی خودم فکر میکردم که اندیکاتور خوب هست و کلی وقت و انرژیمو تلف کردم
        دوست عزیز مثل اینکه متوجه منظور من نشدید،یه کم باز میکنم قضیه رو
        طراحی سیستم سود ده با اندیکاتورها بسیار سخته
        به چنین سیستمی میگن مکانیکال یعنی تحلیل نمیخواد و خودش میگه کی بخر و کی ببند
        تو بازاری پویا مثل ف ا ر ک س سیستمهای مکانیکال به تنهایی جواب نمیدن و دوره ضرر دارن،پس باید با سیستمهای تحلیلی ترکیب بشن
        من یه زمانی کارم شده بود دانلود اکسپرت و اندیکاتور و تست رو اونها که خیلی وقتمو گرفت و کاملا بینتیجه بود
        همین اندیکاتورهایی که تو متا هستند کافیه و بیشتر اندیکاتورها نحوه محاسباتشون و رفتارشون مثل همه،پس دنبال اندیکاتور جدید گشتن فایده زیادی نمیتونه داشته باشه
        این همه اینجا اندیکاتورهای چشم نواز میبینیم ولی هیچ کدوم کار خاصی نمیکنن و دنباله رو قیمت هستند
        من تنها کارایی بعضی از اندیکاتورها رو برای تایید شمارش امواج و یا واگرایی قبول دارم و دیگه هیچ کمکی نمیتونند بکنن
        منظورم همین بود که کسی که نتونه با همین اندیکاتورهای معمول و رایج سیستمی طراحی کنه و یا ازشون کمک بگیره هیچ اندیکاتور دیگه ای هم کمکش نمیکنه
        من چند تا اندیکاتور دارم که تو سایتا بالای 200$ میفروشن ولی اصلا استفاده ای نمیکنم چون به درد نمیخورن
        بهترین اندیکاتوری که دیدم rsi هست
        موفق باشی دوست عزیز
        ویرایش توسط cold_fear : https://www.traderha.com/member/17451-cold_fear در ساعت 07-03-2015, 01:21 AM

        نظر


        • #94
          اندیکاتور دید گرافیکی یک تریدر از بازار است. این که گفته شه اندیکاتورها فقط فرصت سوزی از وقت تریدر هست درست نیست. همینجور که هیچ سیستم و روشی قطعیت نداره سایر ابزارها هم همینطور هستند مثل اندیکاتور و اکسپرت. اگه کسی از من بپرسه اندیکاتور موثرتره یا الیوت و موج شماری و .... . من براش پاسخی ندارم!؟
          همه اینها وضعیت گذشته بازار را نشان میدن و هیچ تضمینی برای تکرار وضعیت گذشته بازار در آینده وجود ندارد.
          یه نگاهی به متن زیر کنید: (مرجع)

          Trade methods that don't work


          Although profitable strategies can be created with multiple methods, even more trade methods can and do separate traders from their money in remarkably short time. The prerequisite for any working trade method is an existing inefficiency and a valid scientific method to exploit it. However, the difference between valid science and the many strange market theories, misconceptions, and myths circulating in the trading scene is not always easy to see for non-specialists. How do you know which way of trading is sound, and which is nonsense? Here's a small part of the long list of trade methods that you better avoid

          Staring at price curves. Discretionary trading - that means, entering trades manually - can be successful under one of the following two prerequisites. First, you have some information about the particular asset that other traders don't have or don't use. Second, you have a stroke of luck. Otherwise you'll lose money at least at the rate of the transaction costs. It's not possible to the human mind to identify profitable trades by looking at a price curve - except, of course, in hindsight. And although we see in Workshop 8 that luck gives a strategy certainly a strong edge, it has one problem: it will end anytime


          Technical analysis. This might come as a surprise, as it's normally considered the very essence of automated trading. Technical analysis uses a toolset of 'technical indicators' for determining trade entry and exit points. How indicators are supposed to work is described in the Technical Analysis chapter - but in a nutshell: they don't. At least not in the way they are normally used. Many studies confirmed that classical technical indicators such as Moving Averages, MACD, 'Stochastic', Ichimoku, etc. have no predictive value whatsoever. Using them for trade signals is equivalent to throwing a coin. Still, even nonpredictive indicators can be helpful for auxiliary purposes. The ATR, for instance, can be used for determining volatility and setting up stop loss distances


          Elliott waves. Ralph Nelson Elliott claimed in his 1938 published book that the prices of financial assets always move up and down in series of five waves. And indeed, you can see all sorts of waves when you stare at price curves long enough. Problem is that imagined waves are not well suited for predicting real prices - and that's true not only for Elliott's waves, but also for the countless other wave patterns invented by his many imitators. No research so far has found any theoretical basis or any statistical evidence of Elliott waves in price curves


          Gann lines. In the early 20th century, the trader William Delbert Gann was desperate as he could not support his family with his trading. But suddenly he discovered the way to success: promoting himself as a genius trader and selling esoteric trade systems and books. Gann was the ancestor of all scammers in the trading scene. No serious tests have ever confirmed any value of his lines, cycles, pyramids, or angles. But even today, many traders still believe in them, to the great joy of their brokers


          Astrology. It's hard to believe, but until recently astrology was widely accepted as a normal trade method and discussed in many trading books. Trading would indeed be a breeze if you could calculate tomorrow's prices just from the positions of sun, moon, and planets. Alas, celestial bodies stubbornly refuse to predict earthly events. A full moon has no correlation to the EUR/USD price, Saturn won't drag down the S&P500 index, and contrary to popular belief, even the sun is not responsible for the change of seasons. All this happens on earth


          Classical candle patterns. With names like "Three Stars in the South" or "Concealing Baby Swallow", they bring some poetry into trading. Candle patterns had been developed in the 18th century by Japanese traders for predicting the local rice markets. Even today, many traders are still squinting at price charts, hoping for a lucky trade when a candle formation matches a profitable pattern in their "Get Rich with Candle Patterns" book. You can easily check if this hope is justified - just run a simple backtest with any of the supported classical candle patterns. And you can confirm this way that the new patterns invented by some clever marketeers - "Lizard's Day" or the like - work exactly just as well as the classical patterns


          Fibonacci numbers. This simple number series - 1, 2, 3, 5, 8, 13, etc. - can be found in patterns of geometric growth, in mathematics as well as in nature. But there's no reason to expect it in price levels or time periods of financial assets. And indeed, it isn't there. Nevertheless traders like the word "Fibonacci", maybe due to its ring of serious math. If a system uses Fibonacci numbers for trade signals, you can be sure that it would also work, and most likely better, with any other numbers


          Harmonic trading. By connecting points on the price curve, you can produce polygonal figures such as diamonds, butterflies, crabs, or bats. Their shapes predict profitable trade entry points. Or do they? Harmonic trading is certainly profitable - for the tool and seminar vendors who invented it. But contrary to the claims of said vendors, there is absolutely no evidence that it ever helped any trader


          Scalping. Systems that trade in minutes or even seconds might have an edge or not - problem is that you'll never know. Due to the bad signal/noise ratio and the feed dependency of price curves at short time frames, backtest results of such systems are very unreliable. An additional problem are the trading costs - commission, spread, slippage - that explode on short time scales, while market inefficiencies disappear. Aside from high frequency trading systems that are an entirely different matter, automated systems work best with time frames in the hour or day range


          Your Trading Style. In trading books you'll often read advices like "place the stop loss at a distance that suits your trading style." This makes you wonder what "your trading style" might be. Do you trade risky, greedy, timidly, or miserly? And should this affect your trade method or the stop loss? Certainly not. Any parameter in a trade system has an optimal or most robust value, and any other value will produce a less than optimal result. As long as you prefer winning to losing, better select your trade methods and parameters not by your style, but by their robustness and performance


          The Holy Grail. On all trader forums you'll find some lengthy threads about systems with miraculous profits. The thread starter has discovered the ultimate trade method. He feeds the thread periodically with reports of his impressive trade results - such as, doubling his account every month - and vague hints about his miracle algorithm. His devotees eagerly absorb any droplet of information in their attempts to replicate the trade method - but alas, to no avail. Miracles have the nasty habit of disappearing at closer look. The thread will eventually dry out when the miraculist got broke or when the last follower has realized that he was following a Fata Morgana


          Martingale or d'Alembert methods. They are used by many trading robots, signal providers, and beginners in roulette: you bet on red or black and double your stake after every loss. Alternatively, you open two new positions for every lost trade. The theory is that a loss increases your win chance the next time. Unfortunately, it won't. On the contrary, market inefficiencies are often autocorrelated, so after losing a trade there's a good chance that you'll also lose the next one. Although martingale systems at first seem to make steady profits - even when trades are entered at random - they will encounter a long loss streak sooner or later* and wipe out the account. If that doesn't matter for you, workshop 8 describes a way to use a martingale system to your advantage


          High Win Ratio. 99% win rate is easy - just use a 5 pips profit target and a 500 pips stop loss distance. You'll then probably win the next 99 trades, regardless of your strategy. Unfortunately the 100th trade will hit the stop and eat up all profit. Even worse, that fatal trade can happen anytime, even right at the beginning. You can easily identify scammers that use a high win ratio for selling their systems: their published profit curve looks like a straight upwards slope, with any trade winning about the same small amount. They don't wait until the 100th trade, though


          Grid trading. Such a system is a special case of using a high win ratio, up to 100%. It opens many trades at a fixed price grid, and takes profit when the price crosses the next grid line. This method can indeed generate a stream of profits for a while when the prices move up and down, but don't move too far away from their initial position. Problem is that they eventually do, causing a fatal loss**. More capital and smaller trade sizes can delay, but not avoid that event. It's easy to tweak grid trading systems for surviving any backtest, so they are often found in trade robots and on trade copy services. There are few exceptions where grid trading can make sense - for instance when runaway prices are hedged with some method, or when the price movement is limited by external factors such as a price cap
          ویرایش توسط Seyedi : https://www.traderha.com/member/14738-seyedi در ساعت 07-03-2015, 09:47 AM

          نظر


          • #95
            به نظر من هم اندیکاتور یک ابزاره. میتونه کمک کنه و مفید باشه ولی تو بازار هر اتفاقی ممکنه بیفته . خیلی از تریدرهای حرفه ای از اندیکاتورها استفاده میکنن و خیلی ها هم توجهی به اندیکاتورها ندارن و هر دو گروه موفق هستن. واقعا در این بازار هیچ گزاره قطعی نمیشه گفت .

            نظر


            • #96
              ITM Financial

              نظر


              • #97
                BloodRabbit_2.2

                نظر


                • #98
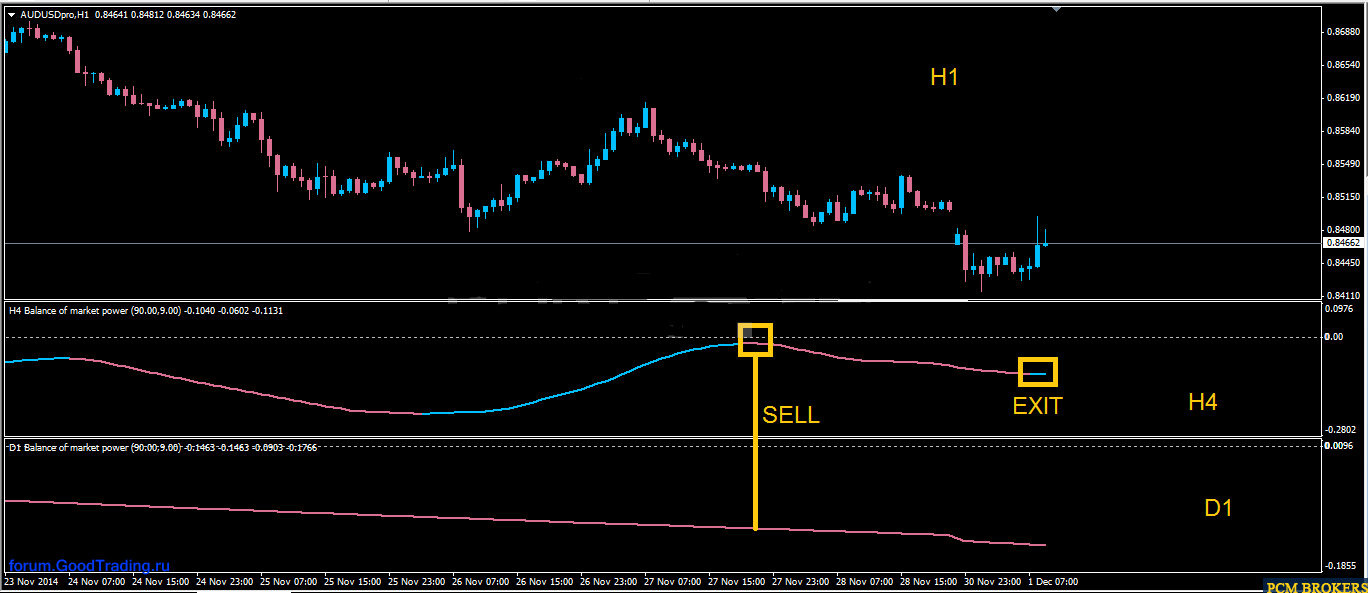
                  اندیکاتور دقیقی است مخصوصا اگه مثل شکل به صورت مولتی تایم فریم بکار بره. (دو میله آخر آن اصلاحی است در بعضی مواقع)
                  Balance of market power nrp_alerts.mq4


                  ویرایش توسط Seyedi : https://www.traderha.com/member/14738-seyedi در ساعت 07-06-2015, 03:43 PM

                  نظر


                  • #99

                    نظر


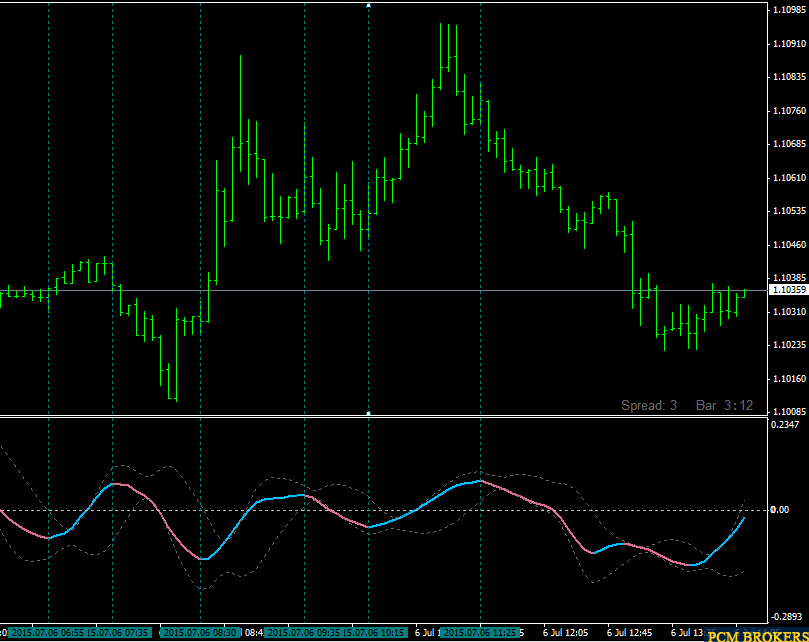
                    • بی زحمت من این اندیکاتور رو میخواستم ولی هر چی گشتم پیداش نکردم میشه لطف کنید برام پیداش کنید؟منظورم اون اندیکاتور پایین عکس هست
                      [IMG][/IMG]

                      نظر


                      • دوست عزيز اين انديكتور اصلاحي هست وقتتو با اين تلف نكن

                        نظر


                        • خیلی جالبه نتایجش. لطفا عزیزی اگه وقت کرد تو هفته پیش رو بررسیش کنه! تایم 15 دقیقه
                          فایل های پیوست شده
                          ویرایش توسط Seyedi : https://www.traderha.com/member/14738-seyedi در ساعت 07-31-2015, 05:32 PM

                          نظر


                          • فایل های پیوست شده

                            نظر


                            • wpr in squares

                              نظر


                              • برای نمایش اخبار سایت myfxbook بر روی چارت خود و همچنین امکان الارم :

                                نظر

                                پردازش ...
                                X